SLA & SLO Tracking
Track Service Level Agreements and Objectives with automated uptime calculations, error budgets, and burn rate alerts.
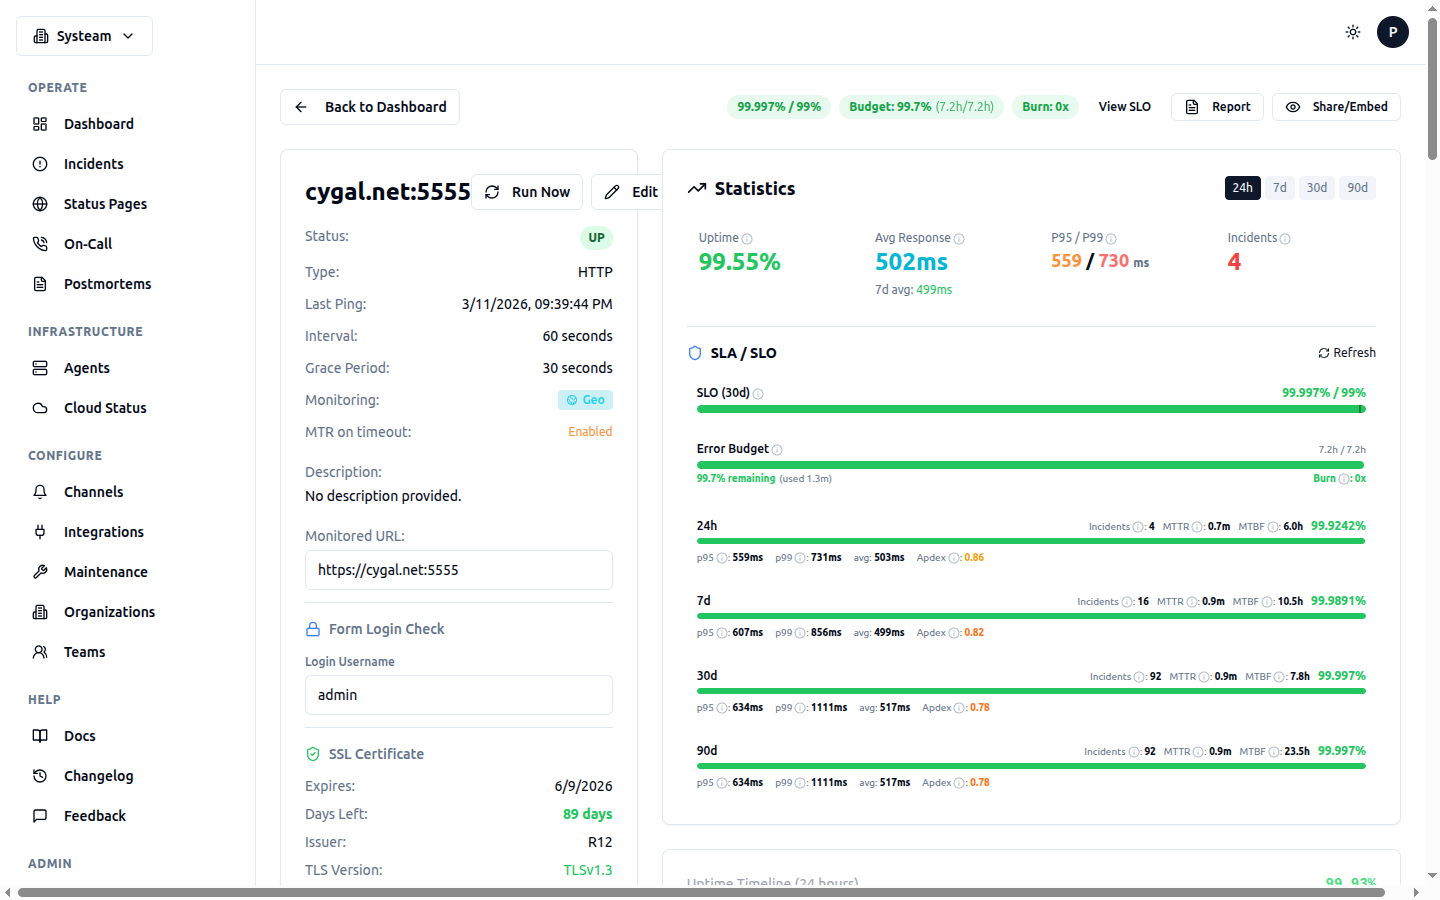
Check detail page showing SLO compliance, error budget, and SRE metrics (MTTR, MTBF, Apdex)
Key Concepts
| Term | Definition |
|---|---|
| SLA | Service Level Agreement — A contractual commitment to your customers about uptime (e.g., "99.9% uptime per month"). SysTeam tracks actual uptime so you can verify you're meeting your SLA. |
| SLI | Service Level Indicator — The actual measured metric (e.g., "99.95% uptime over the last 30 days"). This is what we calculate from your check data. |
| SLO | Service Level Objective — Your internal target for the SLI (e.g., "target 99.9% uptime"). SLOs are typically stricter than SLAs to give you a buffer. |
| Error Budget | The amount of acceptable downtime within your SLO window. For a 99.9% SLO over 30 days, your error budget is ~43 minutes of downtime. |
SLA Tracking
Every check automatically tracks SLA metrics. No configuration needed. Open any check's detail page to see the SLA panel with uptime statistics across multiple time windows:
| Period | Metrics |
|---|---|
| Last 24 hours | Uptime %, total incidents, MTTR |
| Last 7 days | Uptime %, total incidents, MTTR |
| Last 30 days | Uptime %, total incidents, MTTR |
| Last 90 days | Uptime %, total incidents, MTTR |
How Uptime is Calculated
Uptime percentage is calculated as:
- Downtime includes periods where the check status was DOWN
- DEGRADED periods are counted as incidents but not as full downtime
- Maintenance windows are excluded — planned downtime does not count against uptime
- PAUSED periods are excluded from the calculation entirely
MTTR (Mean Time To Recovery)
MTTR is the average duration of incidents within the time period. It tells you how quickly you typically recover from outages:
A lower MTTR means faster recovery. Track this over time to measure improvement in your incident response process.
Configuring SLOs
While SLA tracking is automatic, SLOs require explicit configuration. An SLO lets you set a target uptime percentage and get alerted when your error budget is running low.
Creating an SLO
- Open a check's detail page
- Scroll to the SLO section
- Click Configure SLO
- Set your target and window
- Save
Example: 99.9% Monthly SLO
SLO Settings
| Setting | Description |
|---|---|
| Target Uptime | Your uptime target as a percentage (e.g., 99.9%, 99.95%, 99.99%) |
| Window | The rolling time window for the SLO calculation (7, 30, or 90 days) |
| Burn Rate Alert | Enable alerts when your error budget is being consumed faster than expected |
| Burn Rate Threshold | The multiplier that triggers an alert (e.g., 2× means you'll exhaust your budget in half the expected time) |
Common SLO Targets
| Target | Allowed Downtime / 30 Days | Use Case |
|---|---|---|
| 99.0% | ~7 hours 12 min | Internal tools, non-critical services |
| 99.5% | ~3 hours 36 min | Business applications |
| 99.9% | ~43 minutes | Production APIs, customer-facing services |
| 99.95% | ~21 minutes | Critical infrastructure |
| 99.99% | ~4 minutes | Payment systems, core platform |
Choose Realistic Targets
Setting an SLO target higher than what you can realistically achieve leads to a permanently breached error budget, which defeats the purpose. Start with a target slightly below your historical uptime and tighten it over time.
Error Budget
The error budget is the maximum amount of downtime you can afford within your SLO window while still meeting your target. It's displayed as a visual gauge on the check detail page:
Reading the Error Budget Gauge
- Green — Error budget is healthy. You have plenty of downtime budget remaining.
- Yellow — Error budget is below 50%. Proceed with caution before deploying risky changes.
- Red — Error budget is breached (0% remaining). Your uptime is below the SLO target.
How to Use Error Budgets
Error budgets are a powerful tool for making engineering decisions:
- Budget available — You can safely deploy changes, run experiments, or do maintenance. The budget gives you room for risk.
- Budget running low — Slow down deployments, focus on reliability. Don't risk further incidents.
- Budget exhausted — Freeze non-critical deployments. Focus all effort on improving reliability until the budget recovers.
Burn Rate Alerts
Burn rate measures how fast you're consuming your error budget relative to expectations. A burn rate of 1× means you're using the budget at exactly the expected rate (evenly distributed across the SLO window).
| Burn Rate | Meaning | Action |
|---|---|---|
| < 1× | Consuming budget slower than expected | Healthy, no action needed |
| 1× - 2× | Slightly elevated consumption | Monitor closely |
| 2× - 5× | Rapid consumption | Investigate immediately |
| > 5× | Emergency level | All hands on deck |
When the burn rate exceeds your configured threshold, an alert is sent through your configured notification channels.
Dashboard SLO Column
The main dashboard includes an SLO column for checks that have SLOs configured. It shows a compact error budget indicator:
- Small colored progress bar showing remaining budget
- Green / yellow / red based on budget health
- Use the SLO filter to show only checks with specific SLO health status
Maintenance Exclusion
Active maintenance windows are automatically excluded from all SLA and SLO calculations. This means:
- Planned downtime during a maintenance window does not reduce your uptime percentage
- Incidents during maintenance do not consume your error budget
- MTTR calculations exclude maintenance-related incidents
This ensures your SLA/SLO metrics accurately reflect unplanned outages only.
API Access
SLA and SLO data is available via the API:
/api/checks/{id}/slaSLA metrics (24h/7d/30d/90d)/api/checks/{id}/sloSLO configuration and current status/api/checks/{id}/sloCreate or update SLO configuration/api/checks/{id}/sloRemove SLO configuration{
"check_id": 42,
"periods": {
"24h": { "uptime_pct": 100.0, "incidents": 0, "mttr_seconds": 0 },
"7d": { "uptime_pct": 99.95, "incidents": 1, "mttr_seconds": 320 },
"30d": { "uptime_pct": 99.92, "incidents": 3, "mttr_seconds": 410 },
"90d": { "uptime_pct": 99.94, "incidents": 5, "mttr_seconds": 385 }
}
}