Agents & Geo Monitoring
Monitor your services from multiple locations around the world using lightweight Go agents. Deploy private agents for internal infrastructure or use geo agents for distributed monitoring.
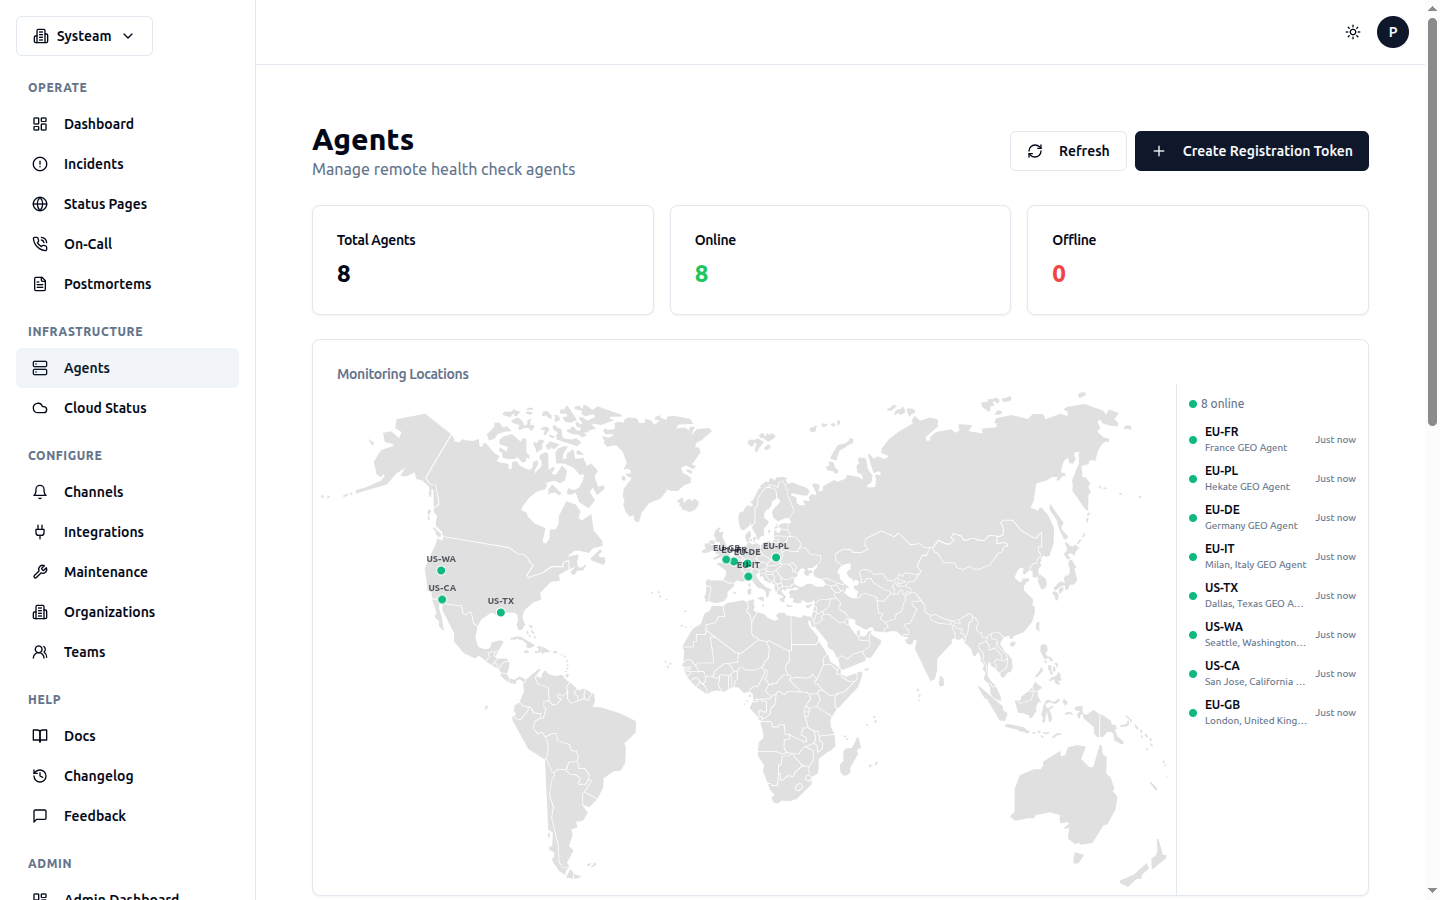
World map showing 8 geo monitoring agents across Europe and the US
Overview
SysTeam HealthChecks uses a Go-based agent that can run checks from remote locations. There are two modes of operation:
| Mode | Purpose | Use Case |
|---|---|---|
| Geo Agents | Managed by SysTeam, distributed globally across 10 locations | Public services — monitor latency and availability from multiple regions |
| Private Agents | Deployed by you, behind your firewall | Internal services — databases, APIs, microservices not reachable from the internet |
Tip
For a detailed step-by-step guide on deploying private agents, see the dedicated Private Agents Setup Guide.
Private Agents
A private agent runs inside your network and executes checks assigned to it. This allows you to monitor internal services that are not accessible from the internet (databases, internal APIs, microservices, etc.).
How It Works
- You deploy the agent binary on a server inside your network
- The agent connects to the HealthChecks API using a secure agent key
- You assign specific checks to the agent in the UI
- The agent fetches its assigned checks, executes them, and reports results back
- The agent sends heartbeats so you can monitor its own health
Deploying a Private Agent
Step 1: Generate a Registration Token
- Go to Agents in the sidebar
- Click Generate Token
- Copy the one-time registration token (it starts with
reg_)
Important
Registration tokens are single-use. Once an agent registers with a token, that token cannot be used again. Generate a new token for each agent you want to deploy.
Step 2: Install the Agent
The agent is a single Go binary (~15 MB). You can build it from source or use the Docker image.
docker run -d \
  --name healthcheck-agent \
  --restart unless-stopped \
  -e HC_API_URL=https://your-healthchecks-domain.com \
  -e HC_REGISTER_TOKEN=reg_your_token_here \
  -e HC_AGENT_NAME=my-private-agent \
registry.cygal.net/healthcheck-agent:latest# Download or build the agent binary
# Place it on your server, then:
export HC_API_URL=https://your-healthchecks-domain.com
export HC_REGISTER_TOKEN=reg_your_token_here
export HC_AGENT_NAME=my-private-agent
./healthcheck-agent# /etc/systemd/system/healthcheck-agent.service
[Unit]
Description=HealthCheck Agent
After=network.target
[Service]
Type=simple
ExecStart=/usr/local/bin/healthcheck-agent
Environment=HC_API_URL=https://your-healthchecks-domain.com
Environment=HC_AGENT_KEY=your_agent_key_here
Restart=always
RestartSec=10
User=healthcheck
[Install]
WantedBy=multi-user.targetStep 3: Verify Registration
After starting the agent, go to Agents in the sidebar. You should see your agent listed with a green Online status. The agent sends heartbeats every 30 seconds.
Step 4: Assign Checks
- Create a new check or edit an existing one
- In the Agent dropdown, select your private agent
- Save the check
The agent will pick up the check on its next polling cycle (typically within 10-30 seconds) and start executing it.
Agent Configuration
| Environment Variable | Description | Default |
|---|---|---|
HC_API_URL | URL of your HealthChecks instance | Required |
HC_REGISTER_TOKEN | One-time registration token (first run only) | - |
HC_AGENT_KEY | Agent key (after registration) | - |
HC_AGENT_NAME | Display name for the agent | hostname |
HC_POLL_INTERVAL | How often to fetch checks (seconds) | 10 |
HC_HEARTBEAT_INTERVAL | How often to send heartbeats (seconds) | 30 |
Tip
After the first registration, the agent receives a permanent agent key. Store it securely. On subsequent runs, use HC_AGENT_KEY instead of the registration token.
Supported Check Types
Private agents can execute these check types:
- HTTP/HTTPS — full support including headers, body, content matching, SSL info
- TCP — port connectivity, response time, banner grab
- ICMP — ping with packet loss, min/avg/max RTT
- DNS — record resolution with multi-server iteration
- Mail Server — SMTP/IMAP/POP3 connectivity checks
Agent Status
In the Agents page, each agent shows:
Geo Monitoring
Geo monitoring lets you check your services from multiple geographic locations simultaneously. Instead of checking from a single point, your services are tested from several locations around the world, giving you visibility into regional performance and availability.
How Geo Monitoring Works
- When you enable Geo Monitoring on a check, it is distributed to all active geo agents
- Each geo agent executes the check independently from its location
- Results are collected and aggregated into an overall geo status
- You can see per-location response times, status, and latency comparisons
Enabling Geo Monitoring
- Create or edit a check
- Toggle Geo Monitoring to enabled
- Save the check
That's it. The check will automatically be picked up by all active geo agents. No agent assignment needed — geo monitoring uses all available geo agents.
Tip
Geo monitoring and private agent assignment can be used together. Enable both on the same check to monitor it simultaneously from your private agents and from the global geo-distributed locations — giving you internal visibility and external perspective in one check.
Current Monitoring Locations
We currently operate 10 geo monitoring agents across Europe and the United States:
| Location Code | Region | City / Provider | Infrastructure |
|---|---|---|---|
EU-PL | Europe — Poland | Warsaw (Hekate) | Bare metal |
EU-FR | Europe — France | Roubaix (OVH) | Kubernetes |
EU-DE | Europe — Germany | Frankfurt (OVH) | VPS |
EU-IT | Europe — Italy | Arezzo (Aruba Cloud) | VPS |
EU-GB | Europe — United Kingdom | London (Oracle Cloud) | VPS |
US-TX | United States — Texas | Dallas (RackNerd) | VPS |
US-WA | United States — Washington | Seattle (RackNerd) | VPS |
US-CA | United States — California | San Jose (RackNerd) | VPS |
US-NY | United States — New York | New York (RackNerd) | VPS |
US-VA | United States — Virginia | Ashburn (RackNerd) | VPS |
Geo Status Aggregation
When geo monitoring is enabled, the check's overall status is determined by aggregating results from all active locations:
| Condition | Overall Status |
|---|---|
| All locations report UP | UP |
| Some locations UP, some DOWN | DEGRADED |
| All locations report DOWN | DOWN |
The DEGRADED status indicates a partial outage — your service is reachable from some locations but not others. This could indicate regional DNS issues, CDN problems, or network routing problems.
Excluding Locations
You can exclude specific locations from a check's geo monitoring. This is useful when:
- A location is experiencing known issues unrelated to your service
- Your service is intentionally not available in certain regions
- You want to focus monitoring on specific regions
To exclude locations, edit the check and use the Geo Excluded Locations field. Enter location codes separated by commas (e.g., US-TX,US-WA). Excluded locations are filtered from:
- Check routing (agents in excluded locations won't execute the check)
- Status aggregation (excluded locations don't affect the overall status)
- All geo charts and visualizations
Geo Monitoring UI
When you open the detail page for a geo-enabled check, you'll see additional panels not available for standard checks:
Geo Status Map
A visual overview showing the current status of each monitoring location. Each location displays as a colored card:
- Green — Location reports UP with response time
- Red — Location reports DOWN with error message
- Gray — No data yet or location excluded
Geo Response Time Chart
A multi-line time series chart showing response time from each location over time. Each location is a separate colored line. Use this to:
- Compare latency between locations
- Identify regional slowdowns
- Spot trends in response time by region
Location Comparison Panel
Side-by-side metrics comparison between locations showing:
- Average response time
- Minimum / Maximum response time
- Current status and last check time
Geo Histogram
A visual timeline showing status history per location. Each row is a location, and colored segments show UP (green), DOWN (red), and DEGRADED (amber) periods.
Response Time Source Toggle
For geo-enabled checks, the main Response Time History chart at the top of the check detail page has a toggle switch:
- Default Location — Shows response time from your starred/default location only. This gives you a single consistent perspective.
- Average — Shows the average response time across all active (non-excluded) locations. Useful for seeing overall trends.
The default location is the one marked with a star icon in your geo preferences. You can change it in the check's geo preferences section.
Central vs Agent vs Geo Checks
Understanding the three execution modes helps you choose the right approach:
| Mode | Runs From | When to Use |
|---|---|---|
| Central | HealthChecks backend server | Default mode. Good for public-facing services when you don't need multi-location data. |
| Private Agent | Your own server/network | Internal services, databases, APIs behind firewalls, VPNs. |
| Geo | Multiple locations worldwide | Public websites, global APIs, CDN-backed services where you need regional visibility. |
Tip
A check defaults to Central mode. To use a private agent, select one in the Agent dropdown. To use geo monitoring, toggle it on in the check settings. You don't need to configure anything else — the system handles routing automatically.
Mail Server Geo Monitoring
Mail server checks with geo monitoring use a special split execution model:
- Geo agents run connectivity checks: SMTP, IMAP, POP3 port availability and response time from each location
- Central server runs DNS-based checks once: SPF, DKIM, DMARC validation, PTR record, and RBL blacklist checks
This avoids redundant DNS queries from multiple locations (SPF/DKIM/DMARC results are the same regardless of where you check from) while still giving you regional connectivity data.
DNS Check Geo Monitoring
DNS checks with geo monitoring also use a split model:
- Geo agents run basic DNS resolution from each location (measuring DNS response time per region)
- Central server runs advanced checks: multi-record monitoring, SOA tracking, WHOIS expiry
Auto-Diagnostic MTR/Traceroute
When any agent-executed check fails with a timeout, the agent automatically runs an MTR (My Traceroute) diagnostic to the target host. This captures the full network path, showing exactly where packets are being lost or delayed.
How It Works
- Agent runs a check (HTTP, TCP, DNS, etc.) and it times out
- Agent detects the timeout error and runs
mtr -c 3 -n --json <host> - MTR results (hop-by-hop data) are attached to the check result
- Results appear in the check detail page under the failed log entry
What You See
When a timed-out log entry contains traceroute data, you'll see a Network Path (MTR) section showing a hop table with:
- Hop # — Position in the network path (1 = first router, last = destination)
- Host — IP address of each hop (or * if unreachable)
- Loss % — Packet loss at each hop (color-coded: green = 0%, amber = >10%, red = >50%)
- Avg / Best / Worst — Round-trip latency in milliseconds
This helps you quickly identify whether a timeout is caused by:
- A problem at the destination server (loss only at the last hop)
- A transit/ISP issue (loss at an intermediate hop)
- A network routing problem (high latency jumps between hops)
Configuring MTR
MTR on timeout is enabled by default for all checks. You can disable it per check:
- Edit the check
- Uncheck Run MTR on timeout
- Save the check
Tip
MTR requires the mtr binary to be installed on the agent host. All managed agents (VM and Kubernetes) have it pre-installed. If you deploy your own private agent, installmtr-tiny (Debian/Ubuntu) or mtr (Alpine) for full support. The agent falls back to traceroute if MTR is not available.
Performance Note
MTR runs only on timeout failures, not on every check execution. Each MTR run sends 3 packets per hop with a 15-second timeout cap, so it adds minimal overhead to your monitoring.
Managing Agents
The Agents page in the sidebar provides a full overview of all registered agents:
- Agent list — Name, status, mode (Private/Geo), location, last heartbeat
- Generate Token — Create new one-time registration tokens
- Agent details — Click an agent to see its assigned checks, recent results, and configuration
Agent Authentication
Agents authenticate using an X-Agent-Key header. The key is a long random string generated during registration. It is hashed with SHA-256 on the server side — the raw key is never stored. If you lose the key, you must re-register the agent with a new token.
Security
Treat your agent key like a password. Anyone with the key can submit check results to your account. Store it securely in environment variables or a secrets manager.