Inbound Events (Event Ingestion)
Receive alerts from external monitoring systems and route them through your on-call escalation pipeline. Works like PagerDuty's Events API v2.
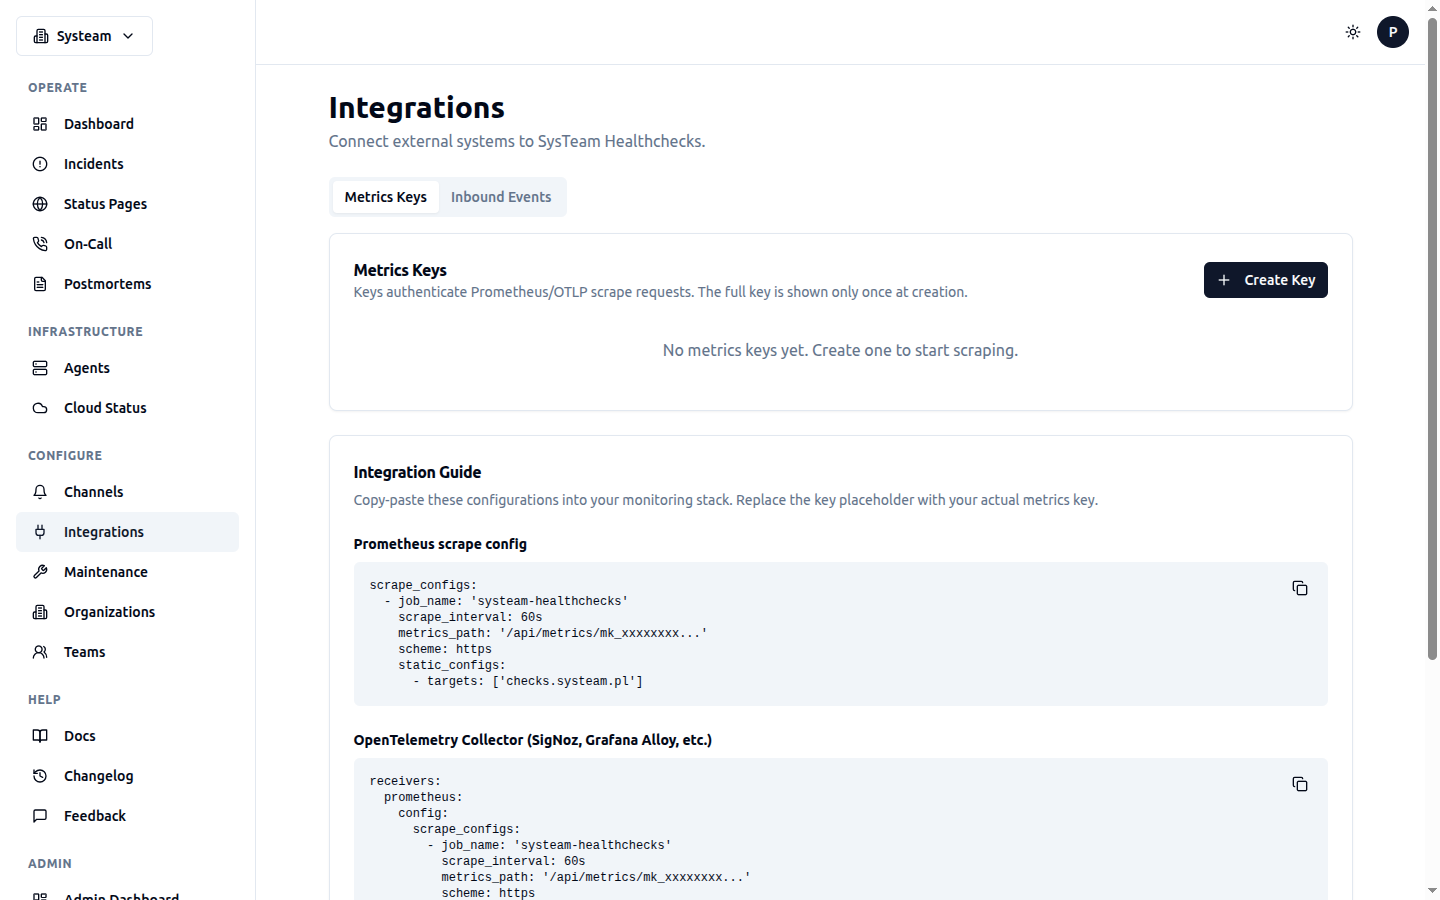
Integrations page with Metrics Keys, Inbound Events, and Prometheus/OTLP configuration
Overview
The Inbound Events API transforms SysTeam HealthChecks from a standalone monitoring tool into a central incident hub. External systems like Prometheus Alertmanager, Grafana, Zabbix, AWS CloudWatch, or custom scripts can send alerts via a simple HTTP POST. Each alert is routed through an escalation policy to notify the right people at the right time.
Key Concepts
Integration Keys
An integration key authenticates inbound event requests. Each key is tied to exactly one escalation policy, which determines who gets notified when an alert fires. Keys use the ik_ prefix and are SHA256-hashed for storage — the raw key is shown only once at creation time.
Deduplication
Every event includes a dedup_key. If an active (non-resolved) incident already exists with the same dedup key and integration key, trigger events update it instead of creating a new one. This prevents alert storms from noisy monitors.
Event Actions
| Action | Effect |
|---|---|
trigger | Create or update an incident. Fires escalation step 0. |
acknowledge | Mark incident as acknowledged. Stops further escalation. |
resolve | Close the incident. Sends recovery notification. |
Severity Levels
| Severity | Use Case |
|---|---|
critical | Service is down, data loss imminent |
error | Service degraded, user-facing impact |
warning | Approaching threshold, action recommended |
info | Informational, no immediate action needed |
Setup
- Create an escalation policy in On-Call → Escalation Policies
- Go to Integrations → Inbound Events
- Click Create Key, select the escalation policy, and copy the generated key
- Configure your external system to send events to
POST /api/events/ingestwith the key asrouting_key
Key Security
API Usage
Trigger an Alert
{
  "routing_key": "ik_abc123def456...",
  "event_action": "trigger",
  "dedup_key": "disk-full-srv01",
  "payload": {
    "summary": "Disk usage > 90% on srv01",
    "severity": "critical",
    "source": "prometheus",
    "component": "disk",
    "group": "infrastructure",
    "custom_details": {
      "current_usage": "93%",
      "mount_point": "/data"
    }
  }
}
Acknowledge
{
  "routing_key": "ik_abc123def456...",
  "event_action": "acknowledge",
  "dedup_key": "disk-full-srv01"
}
Resolve
{
  "routing_key": "ik_abc123def456...",
  "event_action": "resolve",
  "dedup_key": "disk-full-srv01"
}
Response
HTTP/1.1 202 Accepted
{
  "status": "success",
  "dedup_key": "disk-full-srv01",
  "incident_id": 42
}
Integration Examples
cURL
curl -X POST https://checks.systeam.pl/api/events/ingest \
  -H "Content-Type: application/json" \
  -d '{
    "routing_key": "ik_YOUR_KEY_HERE",
    "event_action": "trigger",
    "dedup_key": "my-alert-001",
    "payload": {
      "summary": "CPU usage > 95%",
      "severity": "critical",
      "source": "my-script"
    }
  }'
Python
import requests

response = requests.post(
    "https://checks.systeam.pl/api/events/ingest",
    json={
        "routing_key": "ik_YOUR_KEY_HERE",
        "event_action": "trigger",
        "dedup_key": "disk-full-srv01",
        "payload": {
            "summary": "Disk usage > 90%",
            "severity": "warning",
            "source": "disk-monitor",
            "component": "storage",
            "group": "infrastructure"
        }
    }
)
print(response.json())  # {"status": "success", "dedup_key": "...", "incident_id": 42}
Bash Script
#!/bin/bash
ROUTING_KEY="ik_YOUR_KEY_HERE"
ENDPOINT="https://checks.systeam.pl/api/events/ingest"

# Trigger on high disk usage
USAGE=$(df / --output=pcent | tail -1 | tr -d ' %')
if [ "$USAGE" -gt 90 ]; then
  curl -s -X POST "$ENDPOINT" \
    -H "Content-Type: application/json" \
    -d "{
      \"routing_key\": \"$ROUTING_KEY\",
      \"event_action\": \"trigger\",
      \"dedup_key\": \"disk-full-$(hostname)\",
      \"payload\": {
        \"summary\": \"Disk usage $USAGE% on $(hostname)\",
        \"severity\": \"warning\",
        \"source\": \"disk-check.sh\"
      }
    }"
else
  # Auto-resolve when usage drops below threshold
  curl -s -X POST "$ENDPOINT" \
    -H "Content-Type: application/json" \
    -d "{
      \"routing_key\": \"$ROUTING_KEY\",
      \"event_action\": \"resolve\",
      \"dedup_key\": \"disk-full-$(hostname)\"
    }"
fi
Prometheus Alertmanager
# alertmanager.yml
receivers:
  - name: 'systeam-healthchecks'
    webhook_configs:
      - url: 'https://checks.systeam.pl/api/events/ingest'
        send_resolved: true
        # Note: Alertmanager uses a different payload format.
        # You'll need a webhook transformer (e.g. alertmanager-webhook-adapter)
        # to convert to the SysTeam format.
Alertmanager Integration
alerts[].labels.alertname → dedup_key,alerts[].annotations.summary → payload.summary, and alerts[].status (firing/resolved) → event_action (trigger/resolve).Grafana Webhook
# Grafana Contact Point → Webhook
# URL: https://checks.systeam.pl/api/events/ingest
# Method: POST
# Body:
{
  "routing_key": "ik_YOUR_KEY_HERE",
  "event_action": "{{ if eq .Status "resolved" }}resolve{{ else }}trigger{{ end }}",
  "dedup_key": "grafana-{{ .CommonLabels.alertname }}",
  "payload": {
    "summary": "{{ .CommonAnnotations.summary }}",
    "severity": "{{ if eq .CommonLabels.severity "critical" }}critical{{ else }}warning{{ end }}",
    "source": "grafana",
    "component": "{{ .CommonLabels.instance }}"
  }
}
Zabbix Webhook
# Zabbix Media Type → Webhook
# Script parameters:
#   {ALERT.SENDTO}  → routing_key
#   {TRIGGER.STATUS} → OK or PROBLEM
#   {TRIGGER.NAME}  → summary

var params = JSON.parse(value);
var action = params.status === 'OK' ? 'resolve' : 'trigger';

var req = new HttpRequest();
req.addHeader('Content-Type: application/json');
req.post('https://checks.systeam.pl/api/events/ingest', JSON.stringify({
    routing_key: params.routing_key,
    event_action: action,
    dedup_key: 'zabbix-' + params.trigger_id,
    payload: {
        summary: params.summary,
        severity: params.severity || 'warning',
        source: 'zabbix'
    }
}));
AWS CloudWatch → SNS → Lambda
# Lambda function triggered by SNS from CloudWatch alarm
import json, urllib3

def handler(event, context):
    for record in event['Records']:
        msg = json.loads(record['Sns']['Message'])
        action = 'resolve' if msg['NewStateValue'] == 'OK' else 'trigger'
        severity = 'critical' if msg['NewStateValue'] == 'ALARM' else 'warning'

        http = urllib3.PoolManager()
        http.request('POST', 'https://checks.systeam.pl/api/events/ingest',
            body=json.dumps({
                'routing_key': 'ik_YOUR_KEY_HERE',
                'event_action': action,
                'dedup_key': f"cloudwatch-{msg['AlarmName']}",
                'payload': {
                    'summary': msg['AlarmDescription'] or msg['AlarmName'],
                    'severity': severity,
                    'source': 'cloudwatch',
                    'component': msg.get('Namespace', '')
                }
            }),
            headers={'Content-Type': 'application/json'}
        )
Datadog Webhook
# Datadog Integration → Webhooks
# URL: https://checks.systeam.pl/api/events/ingest
# Payload:
{
  "routing_key": "ik_YOUR_KEY_HERE",
  "event_action": "$ALERT_TRANSITION",
  "dedup_key": "datadog-$ALERT_ID",
  "payload": {
    "summary": "$ALERT_TITLE",
    "severity": "$ALERT_PRIORITY",
    "source": "datadog",
    "component": "$HOSTNAME"
  }
}
Noise Reduction
SysTeam HealthChecks includes several mechanisms to reduce alert noise:
Suppression Rules
Create rules to auto-suppress alerts that match specific patterns. Rules match on fields like summary, source, component, or severity using operators: contains, equals, regex.
Alert Grouping
Configure a grouping window on integration keys to merge rapid-fire alerts into a single incident. When grouping_type is set to time_window, alerts with different dedup keys that arrive within the window are grouped together, incrementing the alert_count on the parent incident instead of creating new ones.
Flapping Detection
For check-based incidents, the system tracks rapid status changes (UP/DOWN/UP/DOWN) using Redis sorted sets. A check that flaps more than 5 times in 10 minutes is marked as flapping, and repeated notifications are suppressed until the status stabilizes.
Team Context
Integration keys can be assigned to a Team. This helps organize which team owns which inbound alert source. When filtering by team on the dashboard or on-call pages, only incidents from that team's integration keys are shown.
How Escalation Works
When a trigger event creates a new incident, the system immediately fires step 0 of the linked escalation policy. Every 60 seconds, the check_inbound_escalation_timeouts task checks for unacknowledged incidents and advances to the next escalation step based on configured delays.
Acknowledging an incident (via the API or UI) stops further escalation. Resolving an incident sends a recovery notification to all previously notified targets.
Rate Limits
The ingest endpoint is rate-limited to 120 requests per minute per IP by default. This is configurable via the INBOUND_RATE_LIMIT environment variable. Rate-limited requests receive a 429 Too Many Requests response.
Data Retention
Resolved inbound incidents and their event logs are automatically cleaned up after 90 days by the cleanup_old_inbound_events daily Celery task. Active (triggered/acknowledged) incidents are never automatically deleted.